A bank's most expensive model risk rarely sits in the model that took months to validate. It sits in the Excel sheet next to it, the one nobody dares call a model.
The Blind Spot
Ask a risk manager about his models and he points you to the inventory. Credit risk models, the VaR engine, the IFRS 9 provisioning model, the internal capital model under Solvency II. Neatly registered, independently validated every year, each with an owner and an expiry date. Someone thought this through, and it shows.
Then ask how the numbers feeding that model are produced, and how the outputs get processed before they land on the board's dashboard. Now it goes quiet. Somewhere in that chain sits a spreadsheet. Usually more than one. Built by an analyst who has since moved to another role, maintained by whoever happens to understand it, stored on a shared drive under a name like calculation_final_v3_actual_final.xlsx. That spreadsheet appears in no inventory. It has never been validated. And it helps determine what the bank believes it knows about its own risk.
This is the blind spot of model risk management. Over the past fifteen years, the field has built an impressive structure around the models it recognizes as models. Meanwhile, a shadow population of calculation tools does effectively the same work, turning inputs into quantitative estimates that drive decisions, entirely outside that structure. End user computing, in the jargon. In plain terms: the spreadsheets, macros and homegrown tools that actually run the organization.
Research into operational spreadsheets has shown the same picture for decades. Across nine field audits of spreadsheets actually used for decisions, 84 percent of the 163 files examined contained at least one error. Narrow that to the five studies with the strictest methodology, counting only serious errors, and the figure rises to 91 percent.1 Not in a lab, not with beginners. In real work, built by professionals convinced of their own accuracy. That conviction is exactly the problem. This article is about the gap between what we call a model and what actually functions as one, what that gap costs, and how to close it.
What Model Risk Management Actually Covers
Model risk management grew up in the financial sector for a painful reason: models turned out to be able to lie with authority. For a Dutch bank or insurer, it is standing supervision. The core discipline should sound familiar by now. Every model runs through a lifecycle: development, implementation, use, ongoing monitoring, eventual retirement. Every model gets independent validation: someone other than the builder tests whether it is conceptually sound, whether it does what it promises, and where it fails. And every model sits in a central inventory, with an owner, a purpose and a risk classification.
Two concepts carry the whole structure. The first is effective challenge: critical, unbiased pushback from people with enough authority, knowledge and independence to actually stand up to a model builder. The second is three lines thinking. The first line builds and uses the models. The second line, model validation and model governance, challenges independently. The third line, internal audit, judges whether the whole system works.3
For institutions in the eurozone, that same pattern is not theory. Through its Targeted Review of Internal Models, TRIM, launched in 2016 and at the time its largest supervisory project, the European Central Bank drove up the quality of internal bank models and pushed back unwanted variation in risk-weighted assets. That project has closed, but the expectations remain: in its revised Guide to internal models, the ECB explicitly asks banks to set up a model risk management framework.5 For insurers, Solvency II regulates the same territory for internal capital models: prior approval, ongoing supervision, and material model changes back up for approval.6 Just across the North Sea, the UK's PRA went a step further: in May 2024 it made this explicitly mandatory for banks through SS1/23, built on five principles: model identification and risk classification, governance, development and use, independent validation, and mitigating residual risk.4
Pay attention to what all these frameworks share, because that is what this whole piece hinges on. They differ in scope, wording and who they bind, but they ultimately want to know the same thing: does this thing change the outcome of a decision? That is a functional question, not a technical one. Anchor the boundary to a definition, and the discussion shifts to what something is called. Anchor it to that question instead, and it stays where it belongs. Under that lens, a neural network is a model. And so is an Excel sheet that turns two numbers into a risk estimate.
For Context: Where the Vocabulary Comes From
The guidance that put this discipline on the map worldwide is American: SR 11-7, published in 2011 by the Federal Reserve and the OCC.2 It defines a model as "a quantitative method, system, or approach that applies statistical, economic, financial, or mathematical theories and techniques to process input data into quantitative estimates." Deliberately broad, and broadly copied: European model policy documents have echoed that wording for fifteen years. For a Dutch institution it carries no direct authority. It is the origin of the vocabulary, useful to know, nothing more.
When Is a Spreadsheet a Model?
This is where it pinches. The definition is broad, but practice is narrow. In many institutions, the model inventory stops at the tools everyone intuitively calls a model: the statistical ones, the complex ones, the ones quants built. The thousands of spreadsheets that feed, correct, supplement or translate those same models into reporting stay out of view. They do quantitative work that drives decisions, but they appear on no list.
The boundary is less fuzzy than it looks. Not every spreadsheet is a risk. A meeting schedule or an address list is not a model, however many cells it holds. The tipping point is whether the file produces quantitative estimates or calculations that feed decision-making or external reporting.7 Once that is true, it is functionally a model, whether anyone calls it that or not, and whether anyone has ever validated it or not.
The One-Question Test
Could an error in this file lead to a wrong decision, an incorrect report or a financial loss? If the answer is yes, the file is a model in the sense that matters, regardless of what the model inventory says. The name on the tab is not the boundary. The consequences of an error are.
Industry literature now openly qualifies end user computing as the largest uncontrolled source of model risk at financial institutions.8 Research firm Chartis estimated the combined "EUC value at risk" for the fifty largest financial institutions at more than twelve billion dollars.8 This is not a fringe phenomenon. It is the part of the model population that is largest, least visible and worst controlled. The reason this went unnoticed for so long is mundane: the validated model got the attention because it had a name. The spreadsheet around it was "just a file."
What Looking Away Costs
The history of the spreadsheet incident is richer than commonly realized, and the amounts do not lie. The best-known case is the London Whale at JPMorgan in 2012. The value-at-risk model for a massive derivatives position ran through a chain of Excel files, with data copied by hand between them. Somewhere in that chain, a formula divided by the sum of two volatility measures where it should have used the average. The effect: the model halved the reported risk. The position spiraled and ultimately cost the bank about 6.2 billion dollars. An order to automate the model and pull it out of the spreadsheet chain had already been given, with a deadline. That deadline was missed.9
It is not an isolated incident. In 2003, the Canadian energy company TransAlta lost 24 million dollars, roughly a tenth of its annual profit, because sorted rows in a bidding spreadsheet became misaligned during a paste. High bids ended up attached to the wrong contracts, and bids could not be withdrawn once submitted. The company's president called it, literally, "a cut-and-paste error in an Excel spreadsheet."10 That same year, Fannie Mae understated its own capital by 1.1 billion dollars because of a faulty formula introduced while implementing a new accounting standard, an error that sailed straight through review.11
Sometimes the error sits in what is visible. During Barclays' acquisition of the remains of Lehman Brothers in 2008, a junior lawyer converted a thousand-row Excel file to PDF just before the deadline. Hidden rows, deliberately marked "do not include," became visible again in that conversion and were pulled into the contract as a result. Barclays ended up buying 179 positions it never wanted, a fact discovered only after the court had approved the deal.12 Fifteen years later, something similar happened without any transaction involved. In August 2023, the Police Service of Northern Ireland responded to a freedom-of-information request with an Excel export from its personnel system. It contained a hidden tab nobody had expanded, listing the name, rank and station of all 9,483 staff, and that tab ended up on a publicly accessible website. Six employees had handled the file before publication. The regulator initially set the fine at 5.6 million pounds and reduced it to 750,000 pounds given the public-sector context, but the real cost fell elsewhere, on staff who had to upgrade home security or move house.30 Outside the financial sector, a spreadsheet error briefly reshaped world politics in 2013: in the influential study Growth in a Time of Debt by economists Reinhart and Rogoff, a handful of countries were simply left out of the cell selection when averaging growth figures. After correction, the reported contraction turned into growth, but only after the original conclusion had already served as an argument for austerity policy.13
And it does not stop in the past. In 2024, it emerged that the Norwegian sovereign wealth fund, the largest in the world, had miscalculated by roughly 92 million dollars after an employee typed December 1 instead of November 1 into a benchmark calculation.14 In 2024, a UK court threw out an 8.9 million pound tax assessment against Thyssenkrupp Materials. The customs settlements had been supplied as spreadsheets with hundreds of thousands of data points, the files contained errors, and the tax authority treated that as a missing return. The Upper Tribunal ruled that a file with a handful of errors is not the same as a file that does not exist, but the case had already run for seven years.31 In November 2025, the UK's entire budget forecast sat on an unprotected link for hours before the minister's speech, because the website's access controls were misconfigured. The document was accessed 43 times from 32 devices in that hour, the internal investigation called it the worst failure in fifteen years, and the chair resigned.32 It continues into the present: in June 2026, PGIM had to retroactively correct the net asset value of three bond ETFs after the external administrator miscalculated it. For the largest fund, the price moved from 42.88 to 42.13 dollars per share, a 1.75 percent correction on the number investors had traded against that day. Outsourcing the calculation does not outsource the risk.33 And in 2020, the UK's health service lost nearly 16,000 positive COVID test results because results were loaded into an outdated Excel format with a 65,536-row limit. Everything below that line silently fell out of the file. About 50,000 potentially infected contacts went untraced, a spreadsheet limit with public health consequences.15
Two caveats belong in this list, because a good argument deserves honest footnotes. The widely cited multimillion-dollar case involving asset manager AXA Rosenberg was not an Excel incident: primary sources from the American regulator consistently describe a coding error in proprietary model software, not a spreadsheet. It is a fine example of model risk, but not an EUC example. And "Lehman" is really two stories: the broader failure of Lehman's own risk models before the collapse, and the Barclays spreadsheet after it. Only the second is a spreadsheet incident. Leaving these distinctions in place keeps the story credible, and that is exactly what a risk manager should demand of his own numbers too.
Why Spreadsheets in Particular Are So Treacherous
That spreadsheets contain errors is a matter of statistics. Researcher Ray Panko compiled the experiments in which experienced builders set up a spreadsheet from scratch, and found error rates of roughly one to six percent per cell with a formula, averaging around three percent.16 That sounds manageable, until you consider that a spreadsheet consists of hundreds of formulas. With an error probability of a few percent per formula, the chance that a large spreadsheet produces a wrong result somewhere is very large. That explains the percentages from the field audits: the logical consequence of that per-cell figure once you factor in scale.
These errors are also the kind that resist detection. The literature distinguishes four stubborn categories, and every incident above fits one exactly. Logic errors: the wrong formula, like the sum instead of the average at JPMorgan. Reference errors: a cell range that fails to move along when sorting or copying, as at TransAlta and in Reinhart-Rogoff. Input errors: a wrong number or a wrong date, as at the Norwegian fund. And version control errors: working in the wrong copy, or a fix applied in one version that keeps haunting a parallel copy.
What makes this really dangerous is the trust. Panko's recurring finding is that both builders and their organizations are structurally too confident in the accuracy of their spreadsheets. A model with a name and a validation stamp gets healthy skepticism; a tidy-looking Excel file gets believed. The formatting creates an impression of reliability, while the logic behind it rarely gets a systematic second look from anyone. Add that the knowledge often lives in one head, it is "Jan's file," and you have a model with no owner, no documentation and no expiry date that nonetheless drives decisions.
A Model Is a Software Artifact
Up to this point, the question has been when a spreadsheet is a model. That question can be answered with a functional test: does this thing change the outcome of a decision? That settles that the file is a model, but not what a model actually is in control terms. And that is exactly the question a controller, risk manager or auditor has to work with next.
Strip away the jargon and something quite ordinary remains. A model takes in data, applies logic to it, and delivers an output that someone relies on. A person built it, it exists in versions, it changes over time, and it contains assumptions someone once chose. That is the description of software. A model is a software artifact, and it deserves the same disciplines as any other piece of software the organization runs.
That comparison carries real weight. No organization deploys a CRM system without knowing who owns it, without logging changes, without separating who builds it from who approves it, without agreements on the master data it holds. For a calculation file that sets provisions or fixes prices, exactly that happens routinely. Not out of neglect: the file was never classified as a system. The disciplines an organization applies to every information system apply directly to a model, with no translation needed.
| Discipline | What It Means for a Model | Where It Is Already Standardized |
|---|---|---|
| Change management | Every change to a formula or assumption is traceable to who, when and why, and the previous version remains recoverable. | ITGC and COBIT for systems; the ICAEW principles on version control and backup for workbooks |
| Documentation | Purpose, scope, assumptions and limitations are recorded, even after the creator has moved on. | SS1/23 and the ECB guide for models; the explanatory sheet from the ICAEW principles |
| Segregation of duties | The builder does not approve his own work, and the person using the output is not the only one who understands the logic. | Three lines of defence; independent validation in Solvency II and SS1/23 |
| Master data | Fixed tables, parameters and reference values have a source, an owner and a refresh cycle. | Data governance; Article 10 of the AI Act for datasets |
| Input | Every data feed has a traceable origin and a completeness and accuracy check, even when someone pastes it in by hand. | Input controls from ITGC; the separation of input and processing in the ICAEW principles and the FAST standard |
| Output | The result is reproducible, its scope is explicit, and there is a record of what was delivered on which date. | Logging and traceability from generic software frameworks |
| Validation | Someone other than the creator tests whether the model does what it claims to do, at a frequency matched to how much weight the output carries. | ECB guide, Solvency II and SS1/23 for internal models |
The right-hand column immediately shows the real problem. A standard already exists for each of these seven disciplines. But those standards live in four separate worlds, and none of the four claims the calculation file of the average organization.
The supervisory frameworks are the most complete. The ECB guide for internal models, the internal-model requirements under Solvency II, and the UK's SS1/23 cover almost all seven disciplines, including independent validation and an explicit model inventory.4 But they apply to banks and insurers licensed for an internal model. No equivalent exists for a housing association, a hospital or a mid-sized company. Simply because no regulator asks for it.
The spreadsheet standards sit at the other end of the spectrum: concrete down to the cell level, but with no organization built around them. ICAEW's twenty principles for good spreadsheet practice, revised in 2024, require that input, processing and output stay strictly separated and identifiable, that the file contains an explanatory sheet, that nothing liable to change is hardcoded into a formula, and that version control, testing and built-in checks exist.25 The FAST standard does the same from the design side, guided by flexible, appropriate, structured and transparent.26 The European Spreadsheet Risk Interest Group has gathered the research and practical experience behind this for more than twenty-five years.27 These are excellent construction rules. What they do not settle is who approves, who validates and who owns the file. The organizational half is missing, and that is exactly where the risk sits.
The generic software and IT frameworks do settle that half. ISO/IEC/IEEE 12207 describes the lifecycle of software, from acquisition to retirement; ISO/IEC 25010 describes the quality characteristics a product can be measured against; and the classic ITGC breakdown into change management, logical access and IT operations is part of the standard financial statement audit.28 But they are rarely applied to a spreadsheet. The file is not in the application portfolio, it has no management organization, and it therefore falls outside the scope handed to the IT auditor. The framework exists. The scope excludes it.
The AI frameworks, finally, are the newest and the best funded. ISO/IEC 42001 requires a management system around AI, the NIST AI Risk Management Framework organizes the work into govern, map, measure and manage, and the AI Act sets hard requirements for data quality, technical documentation, logging and human oversight.29 They touch the same seven disciplines. But by definition they target systems that learn or infer. A deterministic calculation model does not fall under them, however heavily its output weighs.
What remains is a coverage problem. The strictest requirements sit with the sector that already sees the risk, the sharpest construction rules lack an owner, the broadest frameworks look straight past the file, and the newest frameworks exclude exactly the type of model that occurs most often. Outside the financial sector, controlling a model is therefore something an organization chooses to do because it is sensible, not something it must do. That explains why it happens so rarely. It does not make the task bigger, only lonelier: no supervisory letter forces the work, so the organization has to want it on its own.
From Blind Spot to Control
The good news is that this does not start with a new science. The discipline for controlling models already exists. It just needs to extend to the tools that have stayed out of reach until now. That happens in four moves.
First, see what you have. You cannot control what you do not know exists, and organizations often have no idea how many business-critical spreadsheets are circulating. A discovery and inventory round captures them: owner, department, which process they feed, and how critical they are.17 This is usually the confronting part. Organizations consistently find more than expected, and the most important files are often the worst documented.
Then prioritize. Not every spreadsheet deserves the same attention, and pretending otherwise produces a control program that collapses under its own weight. Classify along two axes: materiality, the financial or reporting impact if it goes wrong, and complexity, how many formulas, links and macros the file contains.18 A simple sheet with major impact deserves more attention than a complicated one with no consequences. This grading by risk level is what separates a program that works from one that gets bogged down controlling files that do not matter.
Next, control. On the tools that actually matter, you apply targeted measures. Input controls that reject impossible values. Verification of the formulas themselves, across tabs and links. Version and change management, so a modification gets tested and approved instead of slipped in quietly. Access control and segregation of duties, so the person who builds the file is not also its only reviewer. Documentation of purpose and assumptions. And reconciliation: does the output tie back to a source system or a control total.19
Finally, validate. For the heaviest category, the spreadsheets that are functionally core models, there is no reason to set lighter requirements than for a "real" model. The proven principles of model validation apply directly: is the design conceptually sound, do the outputs check out under backtesting, does it hold up against a benchmark?20 Treat a spreadsheet as a model, and you validate it as one.
Control Must Scale with Dependence
Classifying by materiality and complexity tells you how heavily a file weighs technically. But there is a second question that often cuts sharper, and the owner is best placed to answer it: how much does a decision lean on this thing? Have the business declare that at intake. Does the model only provide insight, with no decision hanging on it? Is it one of several inputs, a partial basis? Or does a decision follow directly from it, making it the sole basis? That self-declared dependence often says more about the real risk than any technical feature.
Plot that dependence against how much the file is actually controlled, and you get a map that immediately shows where it pinches (figure 2). The vertical axis runs with the risk, so at the top sits uncontrolled private EUC: no named owner, no version control, Jan's file. In the middle, managed EUC, with baseline safeguards: an owner, access restrictions, review, simple version control. At the bottom, controlled application: a full software regime with change management, version control, automated testing and controlled deployment (DevOps).
The rule that follows is short: the more a decision rests on a model, the heavier the control regime that belongs with it. A spreadsheet that only colors a chart can stay a private EUC, that is proportionate. But once a decision follows directly from it, it belongs in the controlled regime, not in an Excel file on a shared drive. The dangerous corner is the one at top right, where full dependence coincides with barely any control. That is not a theoretical case: the London Whale brought together exactly that combination, right down to the absence of effective challenge.
Where Tooling Helps, and Where It Does Not
A mature market of EUC management platforms exists: Mitratech ClusterSeven, Apparity, CIMCON, Incisive, which automatically discover spreadsheets, Access databases and, increasingly, Python and R scripts, track changes and score risk. Useful, and at scale (think SOX environments with tens of thousands of files) indispensable. But tooling does not replace governance. It executes it. A platform that logs every change without anyone acting on the findings mainly produces a neatly documented blind spot.
This Is Exactly What Modelio Was Built For
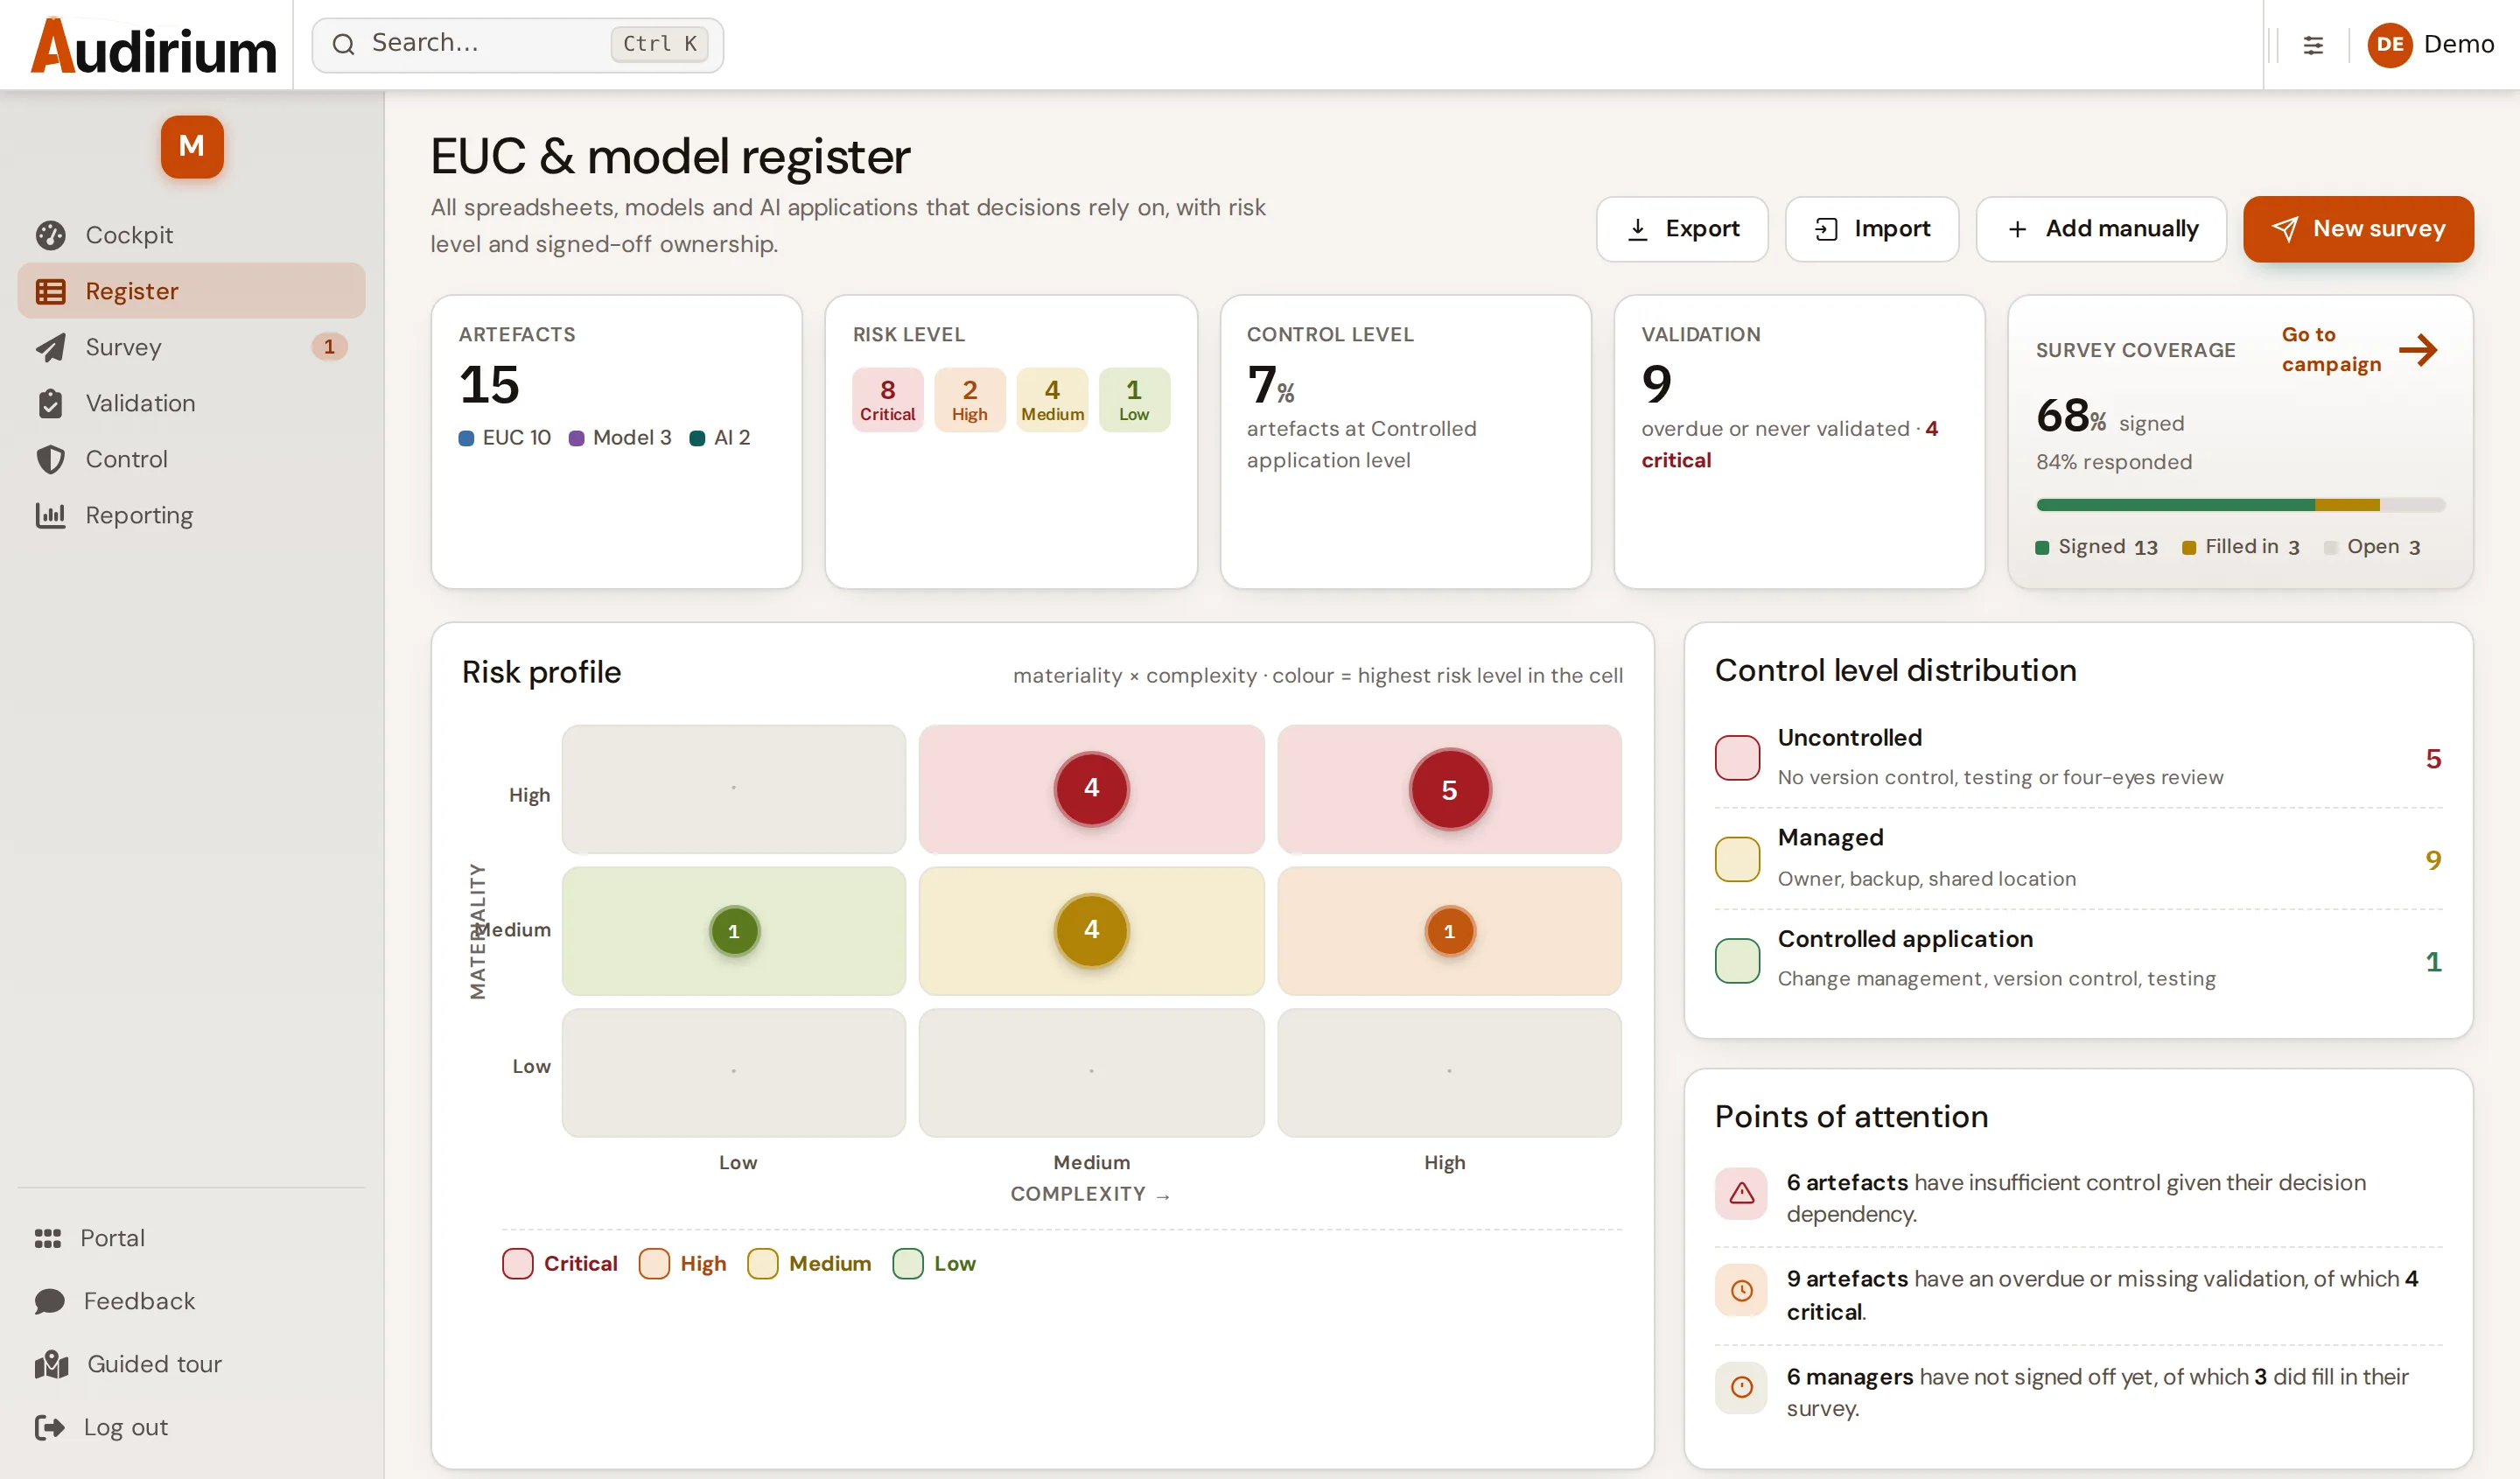
The five-step sequence above, inventory, classify, control, validate and embed, is the foundation of Modelio, Audirium's EUC and model register. The chain runs through intake, registration, classification, control and accountability. What the organization surfaces through that intake, or supplies through an import of existing lists, gets an owner and a risk level based on materiality times complexity, escalated by the dependence described in the previous section: does the file provide only insight, is it a partial basis, or is it the sole basis for a decision? That risk level automatically sets the matching control regime, from uncontrolled through managed to controlled application. Through a magic link, owners declare and sign off on their own artifacts, so the register stays a living document rather than a snapshot, and the organization can use validation and an audit trail to demonstrate that the system actually works.
The Audit Perspective
For internal audit, this is fertile ground, precisely because it has been skipped for so long. The third line does not judge the accuracy of each individual spreadsheet, that is work for the first and second lines, but whether a system exists at all to keep watch over the EUC population. The risk-based audit program follows the logical chain: does an inventory exist, are files classified, and do the critical files actually carry controls?21
The concrete test steps will be familiar to anyone who knows IT general controls. Access: who can reach the file, and is that necessary? Data integrity: are there input controls, or can any value go in? Calculations: do the formulas check out under independent recalculation, including on hidden tabs? Change management: how are modifications logged, tested and approved? The findings are just as familiar, and they recur organization after organization. Business-critical files registered nowhere. No segregation of duties between who builds the sheet and who relies on it. And a handful of parallel versions all called "final."
This article's center of gravity sits with banks and insurers, because supervision is sharpest there and the amounts are largest. That does not make the mechanics exclusively banking business. Anyone reading this from a housing association, a healthcare institution or a mid-sized company lacks the ECB guide and Solvency II, but not the underlying question. Precisely where no regulator forces a model inventory, nobody else asks for one either. Yet the question arrives through another door. Under the revised auditing standards, the external auditor examines the IT applications and end user computing in the chain feeding the financial statements, and a spreadsheet that sets the property valuation or the maintenance provision is exactly such an application. The supervisory board asks what an investment decision rests on. And the moment a model helps decide about people, tenants, clients or candidates, the AI Act is waiting. The difference from a bank is not that the risk is smaller. The difference is that nobody has written it down for you.
The Horizon Shifts, and the Blind Spot Moves With It
Anyone who thinks this is a closed chapter underestimates how fast the landscape is moving, and in a way that reinforces this article's point rather than undermines it. On one side, more regulation is arriving, and this time it is European. The EU AI Act took effect on 1 August 2024 and applies in phases: prohibited practices and the AI literacy requirement since February 2025, rules for general-purpose AI since August 2025, and since 2 August 2026 the majority of obligations, enforcement included. The high-risk categories from Annex III, including creditworthiness assessment of individuals, follow on 2 December 2027.23 The regulation thereby stacks documentation, oversight and transparency requirements on top of the existing model frameworks. And the nature of model risk itself is shifting. Generative AI introduces risks, hallucination, opacity, that the classic frameworks never covered.
On the other side, something striking is happening to the rules themselves, and it is happening outside the EU. The American regulator that once set the standard has recently tightened it.22 The new version is smarter on paper: more risk-focused, less one-size-fits-all, but with one piquant consequence. The definition of what officially counts as a model gets stricter, and the new text states in so many words that the term model excludes "simple arithmetic calculations, such as those found within spreadsheets," as well as deterministic, rule-based processes with no statistical, economic or financial theory underneath them. The regulator names the spreadsheet explicitly, in order to show it the door. Exactly the category where many critical calculation tools sit slips outside the formal rule as a result. Tellingly, that same guidance also explicitly excludes generative and agentic AI from its scope, on the grounds that the technology is new and changes fast. None of this formally binds a Dutch institution, and that is precisely why it is instructive. The lesson is a governance one. Whether something is officially called a model or not, the risk does not change. Taking your critical spreadsheets seriously only once a rule forces the issue means arriving too late. Governance should not stop where the compliance text stops.
The most important point may be this: the blind spot moves, but it does not disappear. Where it was Excel yesterday, today it is the low-code and no-code platform where employees build their own applications without writing a single line of code. Gartner predicted that by 2025, seventy percent of all new business applications would be built with low-code or no-code technology, up from less than a quarter in 2020, while survey after survey finds a clear majority of organizations admitting they have no governance over it yet.24 It is end user computing in a new coat: the same dynamic of well-intentioned self-sufficiency that slips past every form of oversight. The names change: spreadsheet, script, citizen-developed app, but the pattern is always the same.
What It Really Comes Down To
Model risk management has matured around the models it recognizes as models. The next step in that maturity is recognizing that the definition of "model" was always about function, not form. What matters is the simple question of whether an error in that thing can cause a wrong decision, regardless of statistical sophistication, the label on the tab, or whether a quant was involved.
The real test for an organization, then, is not how thick the validation report for the flagship model is. It is whether anyone can answer which spreadsheets actually run the business, and whether those files carry the same discipline as the models that already have a name. Until that answer exists, the organization's most expensive error is not the one you validated. It is the one you never dared call a model.
Literature and Sources
References
- Panko, R. Audits of Operational Spreadsheets. University of Hawaii. Nine field audits (1995-2008) of 163 operational spreadsheets found errors in 84% (weighted average); across the five studies with the strictest methodology, counting only serious errors, 91% of 55. The older, widely cited finding of "94% of 88 spreadsheets across seven studies" comes from Panko's earlier survey and was later revised by Panko himself. panko.com
- Board of Governors of the Federal Reserve System & OCC (2011). Supervisory Guidance on Model Risk Management (SR 11-7 / OCC Bulletin 2011-12). Published 4 April 2011. federalreserve.gov
- Yields.io (2023). The Three Lines of Defence in Model Risk Management. yields.io
- Bank of England / PRA (2023). SS1/23, Model risk management principles for banks. Effective 17 May 2024. bankofengland.co.uk
- European Central Bank (2021). Targeted Review of Internal Models (TRIM), Project report. bankingsupervision.europa.eu. Standing expectations: ECB, Guide to internal models (revised February 2024, most recent version July 2025), with an explicit section on setting up a model risk management framework. Guide to internal models (July 2025)
- EIOPA. Solvency II, Internal models (art. 120-125). eiopa.europa.eu
- Apparity. Model Risk Management & The Elephant in the Room. apparity.com
- Mitratech (ClusterSeven). End User Computing Risk Management, including Chartis's estimate of "EUC value at risk" at over $12 billion for the 50 largest financial institutions. mitratech.com
- Groenfeldt, T. (2013). Solutions To Spreadsheet Risk Post JPM's London Whale, Forbes; and Revolution Analytics, Did an Excel error bring down the London Whale? (2013). Loss ~$6.2 billion; a formula divided by the sum instead of the average of two hazard rates. Primary source: US Senate Permanent Subcommittee on Investigations, JPMorgan Chase Whale Trades: A Case History of Derivatives Risks and Abuses (2013). forbes.com
- The Register (2003). Excel snafu costs firm $24m (TransAlta). theregister.com
- Full Stack Modeller. The Fannie Mae Spreadsheet Error, understated own capital by ~$1.1 billion (2003). fullstackmodeller.com
- The Register (2008). Lehman Excel snafu could cost Barclays dear; AccountingWEB, Hidden spreadsheet rows hit Barclays with toxic Lehman contracts. theregister.com
- Bloomberg (2013). FAQ: Reinhart, Rogoff, and the Excel Error That Changed History. bloomberg.com
- Financial Times (February 2024), The Norwegian sovereign wealth fund's $92mn Excel error: an error in the mandate benchmark calculation (wrong date, 1 December instead of 1 November) led to a downward correction of roughly NKr 980 million. Summarized with sourcing by spreadsheet-risk trade publication i-nth. i-nth.com
- Daring Fireball / Office Watch (2020). Excel row limit caused loss of 16,000 COVID test results in England, .XLS limit of 65,536 rows; ~50,000 contacts untraced. office-watch.com
- Panko, R. Spreadsheet Development Error Experiments. Laboratory experiments in which participants build a spreadsheet from scratch: reported cell error rates of 1.1% to 5.6%, averaging around 3.2%. panko.com
- KPMG UK (2022). Our Approach to Managing the Risk of End User Computing (EUC). kpmg.com
- Apparity. Building a Spreadsheet Risk Assessment Model, grading by risk level based on materiality and complexity. apparity.com
- Mitratech. The Ultimate End User Computing Checklist; soxmadeeasy, EUC Applications; Audit Programs. mitratech.com
- RiskSpan. Mitigating EUC Risk Using Model Validation Principles. riskspan.com
- soxmadeeasy. End User Computing (EUC) Applications, Audit Programs. soxmadeeasy.com
- Federal Reserve (2026). SR 26-2: Revised Guidance on Model Risk Management (OCC Bulletin 2026-13); Sullivan & Cromwell memo. Replaces SR 11-7 (2011). The new definition limits "model" to a complex quantitative method and explicitly excludes: "simple arithmetic calculations, such as those found within spreadsheets, as well as deterministic rule-based processes and software where there are no statistical, economic, or financial theories underpinning their design or use." Footnote 3 places generative and agentic AI outside the scope. federalreserve.gov
- European Commission, Timeline for the Implementation of the EU AI Act (accessed August 2026): entry into force 1 August 2024; prohibited practices and AI literacy from 2 February 2025; general-purpose AI from 2 August 2025; the majority of obligations and enforcement from 2 August 2026; high-risk systems from Annex III, including creditworthiness assessment of individuals, from 2 December 2027. ec.europa.eu
- Gartner forecast (2021): 70% of new business applications will be built with low-code or no-code technology by 2025, versus less than 25% in 2020. The figure is a prediction, not a measured outcome. For the governance gap: KPMG EMEA survey, summarized by TXMinds, Low-code governance and citizen development. txminds.com
- ICAEW. Twenty principles for good spreadsheet practice. Revised edition 2024. Among other things: separation of input, processing and output; an explanatory sheet in the workbook; nothing liable to change hardcoded into a formula; backup and version control; testing and built-in checks. icaew.com
- The FAST Standard Organisation. The FAST Standard, version 02c (July 2019). FAST stands for flexible, appropriate, structured, transparent; the rules cover workbook structure, worksheet structure and formula design. fast-standard.org
- European Spreadsheet Risk Interest Group (EuSpRIG). Research and Best Practice. A library of more than two hundred research papers on spreadsheet risk, built up since the late 1990s. eusprig.org
- ISO/IEC/IEEE 12207:2017, Systems and software engineering, Software life cycle processes, and ISO/IEC 25010:2023, Product quality model (nine quality characteristics, including reliability, security and maintainability). For the control side: COBIT and the standard ITGC breakdown into change management, logical access and IT operations. iso.org
- ISO/IEC 42001:2023, Information technology, Artificial intelligence, Management system, and NIST, AI Risk Management Framework 1.0 (2023) with its four functions govern, map, measure and manage. The AI Act sets the requirements for data governance (Article 10), technical documentation, logging and human oversight for high-risk systems. iso.org · nist.gov
- Information Commissioner's Office (2024). Penalty Notice: Police Service of Northern Ireland, 26 September 2024. Fine of 750,000 pounds (initially set at 5.6 million), 9,483 individuals affected, incident 8 August 2023. ico.org.uk
- Thyssenkrupp Materials (UK) Ltd v HMRC [2024] UKUT 00079 (TCC), 28 March 2024. Bills of discharge submitted as spreadsheets with 100,000 to 200,000 data points. gov.uk
- Office for Budget Responsibility (2025). Report of investigation into the November 2025 Economic and fiscal outlook publication error, 1 December 2025. obr.uk
- PGIM (2026). PGIM Announces Net Asset Value Restatement for Three Exchange-Traded Funds (PAB, PSDM, PTRB), press release 2 June 2026. NAV of 29 May 2026 restated on 1 June 2026 after a calculation error at the external fund administrator. businesswire.com