A sample of twenty five items tells you something about those twenty five items. The source system, meanwhile, has recorded for every order, invoice or case who did what, when and in which order. DIVE, the process mining app from Audirium, reconstructs from that record how the process actually ran, sets it against the design and tests the full population against eight controls. The result is an audit finding with the evidence trail attached to it, and only in second instance a process diagram.
In brief
What DIVE is, in three lines.
DIVE is process mining for internal audit. You load an export from a source system (ERP, case management, service desk) and DIVE reconstructs which steps were taken, in which order, how long they took and by whom. Up to that point every process mining platform does the same.
The difference is in the last step. DIVE sets the reconstructed practice against the process as it was drawn, including the controls attached to each step, and turns the difference into a test you can explain to a third party.
The outcome then reads: this step carries the control Credit check and was skipped in 591 of 10,000 cases. With the population, the coverage and the rule used alongside it, so a reviewer can recalculate it.
What lands on the auditor's desk
Five places where the sample falls short, and one where the full population puts you on the wrong foot instead.
The sample misses precisely the exception
A control that was bypassed in 591 of 10,000 cases usually does not surface in a draw of forty files.
A bank account that changes shortly before a payment certainly does not: that pattern is close to impossible to find with a sample, and a matter of seconds on the full population.
Tested on rights, not on what happened
An access rights analysis shows who is allowed to. It does not see who actually did it through an emergency account, stacked roles or a stand-in. Those routes are the interesting ones.
Last month is no evidence for this month
If the mandate limit is adjusted along the way, the March outcome silently moves to the new definition. Without version control on the test itself, there is no saying any more what was tested against back then.
The event log has to be dug up first
Three fields are mandatory: a case id, an activity and a timestamp that includes the time. A general ledger export with only a posting date is not enough, because the order within a day is then undetermined. What each Dutch source system does and does not deliver is set out below.
An administration with gaps is a finding in itself
Missing case ids, unreadable timestamps, duplicates, batch postings, cases with a single step. An export in which 8% of the rows have no case id deserves its own sentence in the report, not a silent correction.
Not every deviation is an error
A quotation that comes back signed for amendment is rework, not a bypassed control.
If a signal touches more than 80% of the cases, it is the norm and not a deviation. If the tool does not make that distinction, a test on the full population also delivers the full population in noise.
That last point is why greater coverage does not deliver more assurance by itself.
A list of four thousand hits is not a work plan, and a hit a reviewer cannot retrace is worth less in a file than a sample that can be retraced.
So the question has two halves: how you get from twenty five to everything, and how you then get from everything back to the twenty cases that actually matter, without anything dropping out of the file along the way.
The principle: the test as a recorded item
An exploratory analysis is a button: you point at a column, you get an outcome, and once the screen closes nothing has been kept.
For an exploration that is exactly right. For the question which controls did I test on the full population this quarter, and at what threshold it is too little.
A control test in DIVE is therefore a record: a name, a type, the parameters, a reference to the control in the control framework, a weight from 1 to 5, and a version number.
Every execution leaves a test run with the population size, how much of it could be assessed, the coverage, the fingerprint of the source columns and a frozen copy of the definition as it stood at that moment.
Adjust a threshold and the version increments, and the March outcome stays attached to the March definition. Change only the name and it does not increment, because that does not move the outcome.
Population and coverage are not the same. Next to the population, everywhere, stands the share of cases on which the test could form a judgement.
In a threshold test a case without a readable amount falls outside it, in segregation of duties a case without a recorded performer.
Quietly leaving out that difference would make the coverage look better than it is, and that number is exactly what "we tested everything" stands or falls on.
The same principle runs through the rest of the app.
A hit is an indicator and not a finding; DIVE enforces the order: first confirm against the source document or dismiss it as a false positive, and only then can it be turned into a finding.
An exploration (what happens to the outcome if the norm were somewhere else) gets its own card with a dashed border and the mark exploration, not an executed test, records no execution and puts no hit at all into the work list. In an audit file that is the difference between a finding and a thought experiment.
The model underneath
Six layers. Each layer builds on the previous one, and nothing is retyped afterwards.
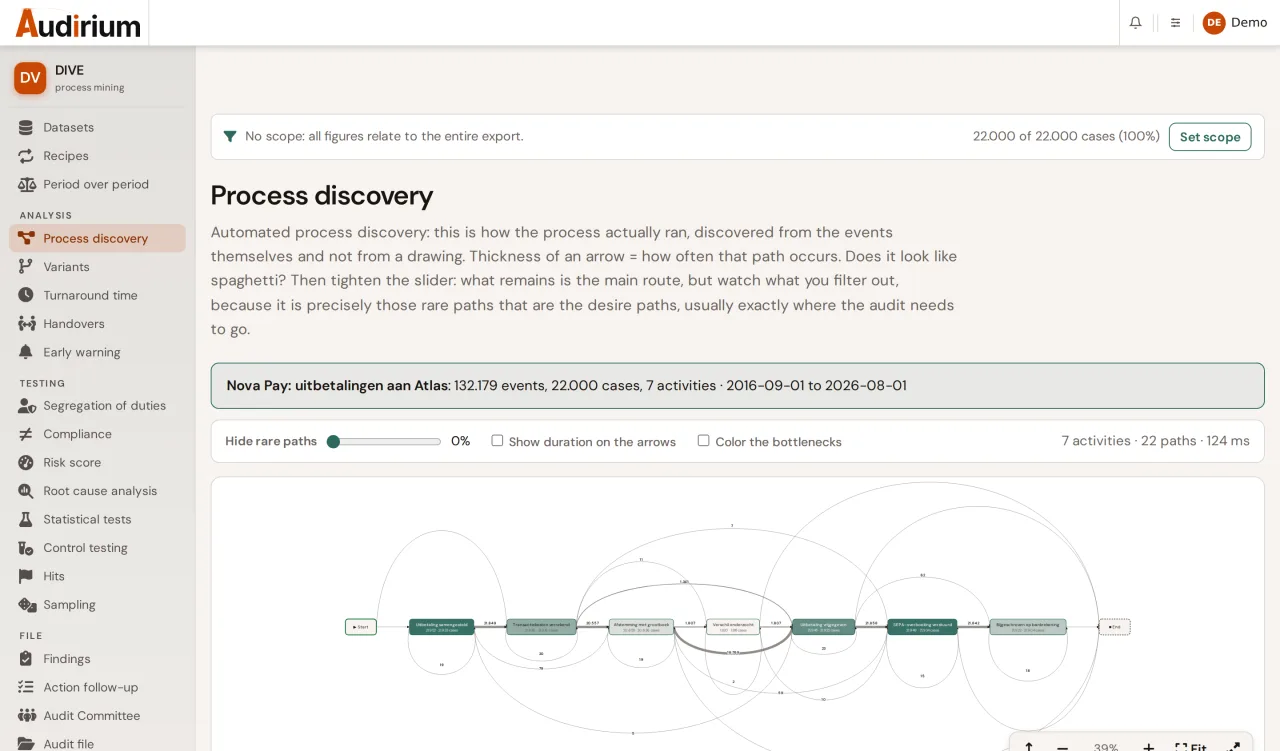
The calculation engine is DuckDB with the event log as a Parquet file; the calculation core is built in house, without an external process mining library. A process graph over five million events costs roughly a third of a second.
Data is stored separately per organisation, as with every app in the suite.
What the auditor takes from it
What you put in the report, and what you have to say alongside it.
The test that shows the difference
Master data change before payment finds a master data item that changes within N days before a payment, in the same case.
Alongside it: segregation of duties, duplicates on one or more attributes, an amount above the mandate limit without an approval step, postings outside office hours or after the period close, missing numbers in a sequence, the reconciliation against a control total, and Benford, here as exceptions above the 95% threshold and explicitly as an attention signal, not as evidence.
A score you can retrace
Every exception gets 0 to 100 points from four components: financial significance (up to 40), degree of deviation within its own type (up to 25), repetition by the same person involved (up to 15) and the weight of the control (up to 20).
Every component is stated in words with the hit, because in the right of reply you have to be able to explain why this exception ranks above that one.
Control bypassed, in numbers and in a picture
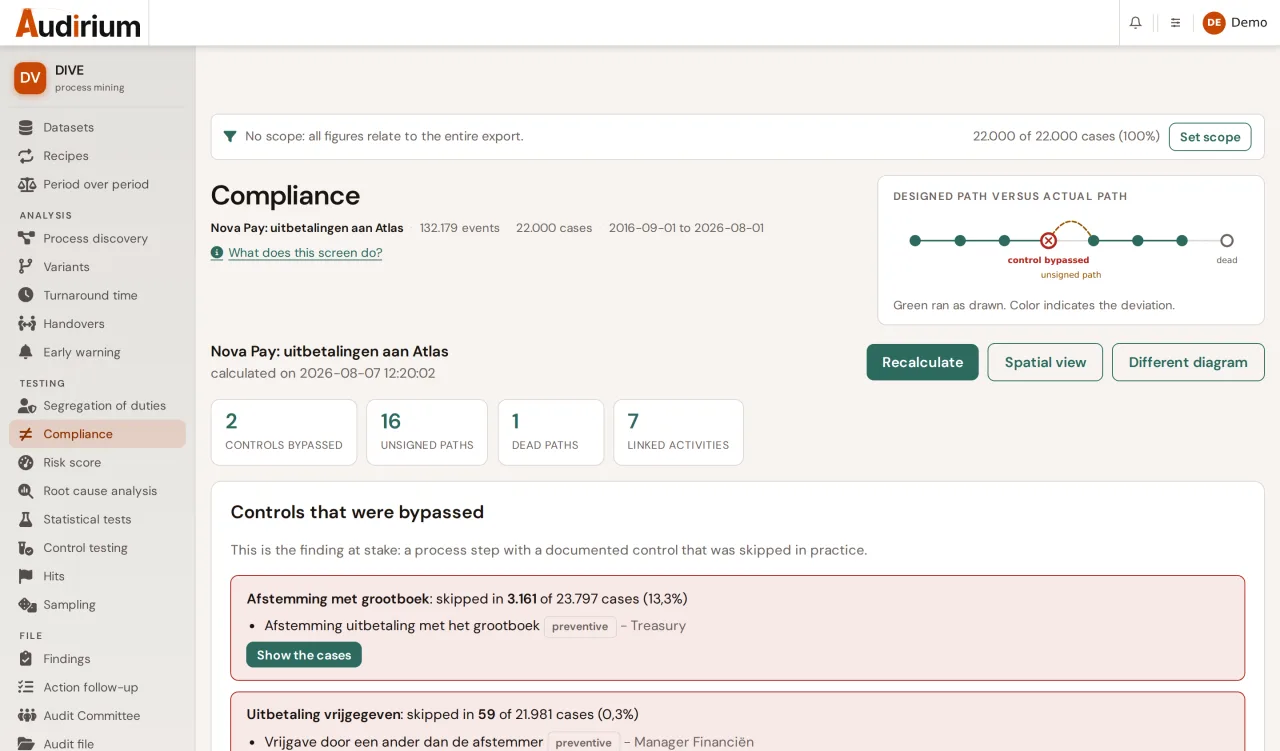
Against the diagram DIVE reports three kinds of deviation: a skipped step that carries a control (with the name, type and owner of that control), a transition that occurs in the data but was not drawn, and a drawn transition that does not occur in the data.
The spatial view lays the drawing flat and hangs the actual paths above it: an arc that goes over a gateway is literally a bypassed control.
Not measured is not zero
Two exports side by side, with a comparability check first: overlapping periods, a markedly different length, a gap between them, different source columns.
A segregation of duties rule that was not reinstated in the second round stays empty, with the pointer to apply the recipe.
At the bottom the trend across all rounds, because two points are a difference and only a line shows whether an improvement holds.
What if the norm were different
The sensitivity analysis recalculates the same test across a range of thresholds around the established norm, so you can see whether a finding hangs on the norm or stands apart from it.
The dry run first shows a new definition what it would yield, including how many of those hits the team already assessed as not a finding.
Sampling precision puts attribute sampling and monetary unit sampling side by side, with the skewness of the population as the reason for the advice. All four carry the mark exploration and do not count as an executed test.
A sample a reviewer can repeat
Even on a full population you want to check a number of cases in the source system.
DIVE draws at random or monetary, from all cases or from the hits, and records the seed in the file. With the same seed, population and method a reviewer gets exactly the same cases back.
The audit committee summary delivers the work in the form it can take on a meeting agenda: what was examined, what was found, what was tested and what was not, what is being done about it, and the difference with the previous round.
Every sentence follows from a figure and a fixed threshold; no data goes to a language model, not even to turn it into nicer sentences.
The caveat is a section of its own and not a footnote: analyses that were not run, a coverage below one hundred percent (with the sentence that those cases remained untested), an active scope, records that dropped out on import.
What the source systems deliver
Every CSV or Excel works, but not every system records enough for process mining. The state of play for Dutch systems in practice, from the documentation:
| System | Usable | Notes |
|---|---|---|
| Municipal case management systems (ZGW) | yes | The VNG standard includes an audit trail with user, action and timestamp per case. Some installations still run on the older ZDS standard. |
| Dynamics 365 Business Central | yes | Audit system fields on every table plus the Change Log with user, date and time. |
| TOPdesk | yes | Progress trail per incident or change. |
| AFAS Profit | probably | GetConnectors are flexible enough; whether workflow steps carry both a time and an employee has to be determined per environment. |
| Exact Online, Twinfield | limited | Only creation and modification moments per record, no status history. One event per posting. |
| SAP | via extract | CDHDR/CDPOS is the richest audit source there is, but it delivers an extract, not a connection. |
How it runs in practice
From export to finding, and from finding to the next export.
Load the export
Drag the export in. DIVE proposes the columns on their names and shows, for every possible date format, the parse percentage and the date range on the actual values; you confirm.
This is where process mining analyses most often go quietly wrong, so here it is made explicit.
Assess the data quality
Before anything is calculated you see what is off: missing case ids, unreadable timestamps, duplicates, batch postings, cases with a single step.
That report goes into the file. Decide here whether the export is usable and what you will say about it in the report.
Analyse and set the scope
Process discovery, variants, throughput time, segregation of duties and handovers on the full population.
Set the scope with the filter stack; what you type is a draft until you record it, so you can try things out without creating a line in the file you will never base a conclusion on.
Test against the design
Link a diagram from Flowmap. DIVE proposes, on name similarity, which log activity belongs to which process step; you confirm that mapping yourself, because a wrong mapping produces a tidy looking but incorrect finding.
After that: bypassed controls, undrawn paths, dead paths.
Record and run the control tests
Record a test per control with parameters, weight and a reference to the control framework, after a dry run if you want.
Every execution is a test run with population, coverage and frozen definition. Run it again and only the hits not yet assessed disappear; what you already ticked off stays.
Validate, finding, action
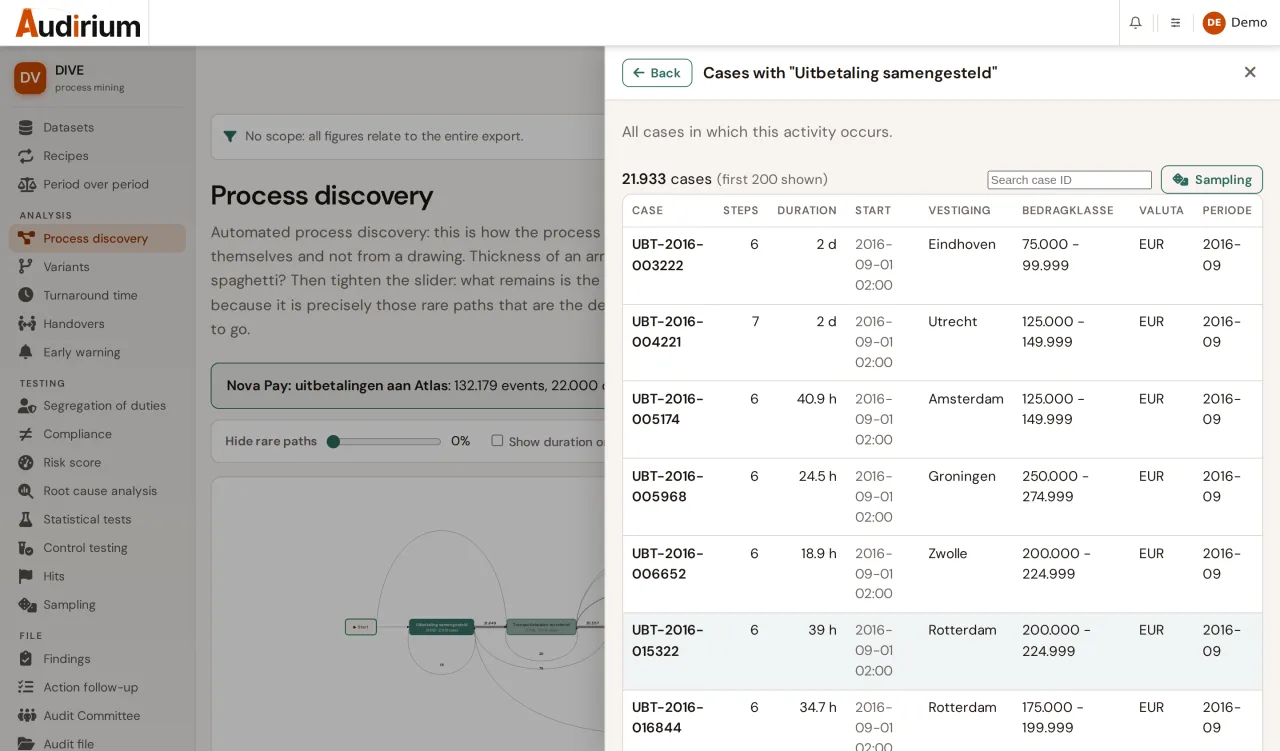
Confirm a hit against the source document, through a deep link to the record in your source system (DIVE then keeps no document at all) or an attached item.
Only after that does it become a finding, with the evidence trail, and does it get actions with an owner and a deadline.
Record it as a recipe
Once the analysis stands the way you want it next time, record the parameters with the source system.
Next month's export is recognised by the fingerprint of the column names.
Applying it is never blind: first a dry run with fits, fits in part or cannot per component, and whatever cannot is named in the execution report. A period filter deliberately does not carry over.
Practical
The questions that usually come second.
- Hosted in the European Union. On our own servers at Hetzner in Nuremberg, Germany. Data is stored separately per organisation.
- No client data leaves the server. No cell value, case, amount or name goes from this app to an external service or to a language model. No figure, judgement or conclusion comes from a model: the analyses, scores and coverage percentages run on fixed rules and give the same outcome tomorrow on the same data.
- Privacy by design. The performer field is pseudonymised on import with a salt per dataset, the link back is not kept, and what you do not map is not stored. If an identity is needed for the right of reply, that request goes to the administrator of the source system; DIVE records the request. An event log with a performer field touches employee representation; the app is built so that conversation becomes easier, not harder.
- Traceable to GIAS Standard 14.1. Information is only sufficient when a knowledgeable third party can repeat the work and reach the same conclusion. The audit file exports precisely that: the column mapping, the data quality report, the assessment of every hit, the seed of every sample and the hash of the source export.
- Large exports. Up to 10 GB per file, resumable, with a disk space check beforehand. A log of tens of millions of events is calculated once and read from the stored outcomes after that.
- Dutch and English. The interface is bilingual and follows your preference across the whole suite. Your own content (activity names, finding texts) stays as you enter it; a few sentences composed by the server, such as filter descriptions, are at this moment still only in Dutch.
Where it stands now. DIVE has been in beta since August 2026: in use with real data, by a limited group of organisations with a role on the app, and not yet generally available.
The core (loading, analysis, conformance, the eight control tests, file and recipes) is in place; the explorations date from the end of August 2026 and are therefore younger. I would rather say that up front than have you find it out along the way.
What is deliberately not in it: task mining at workstation level, prediction of the remaining duration of cases in progress, and an AI assistant that answers questions or drafts findings. For that last one a separate consideration applies that has not been made yet, and as long as it has not, no figure at all comes out of a model.